Survival Modelling
Variable studies is the time until an event occurs
Predict when some event will happen
Focus on right-censored data
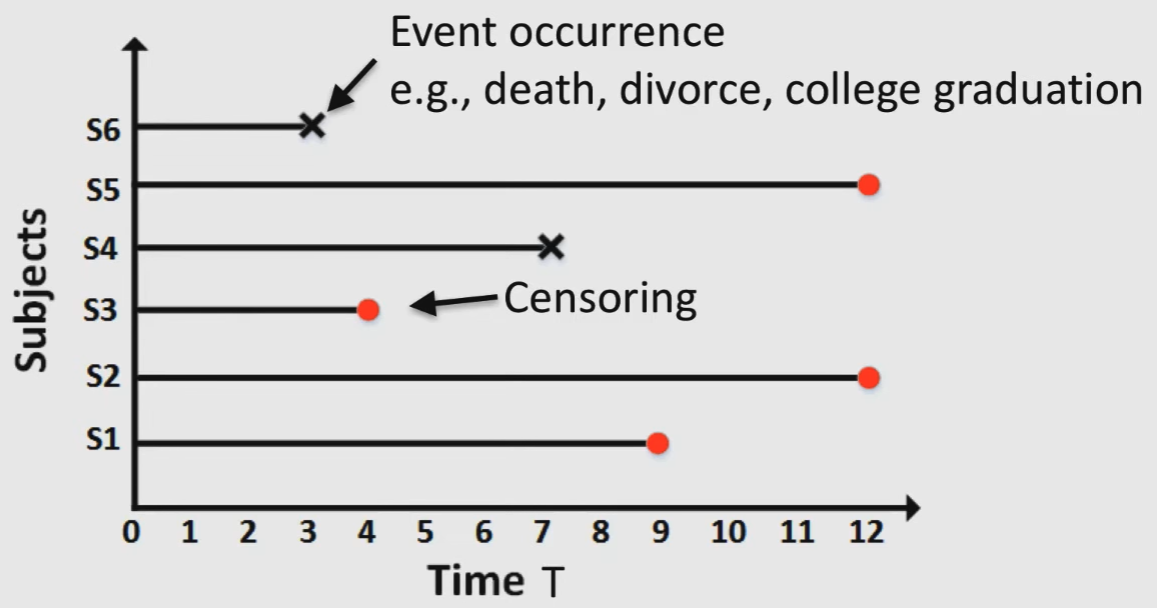
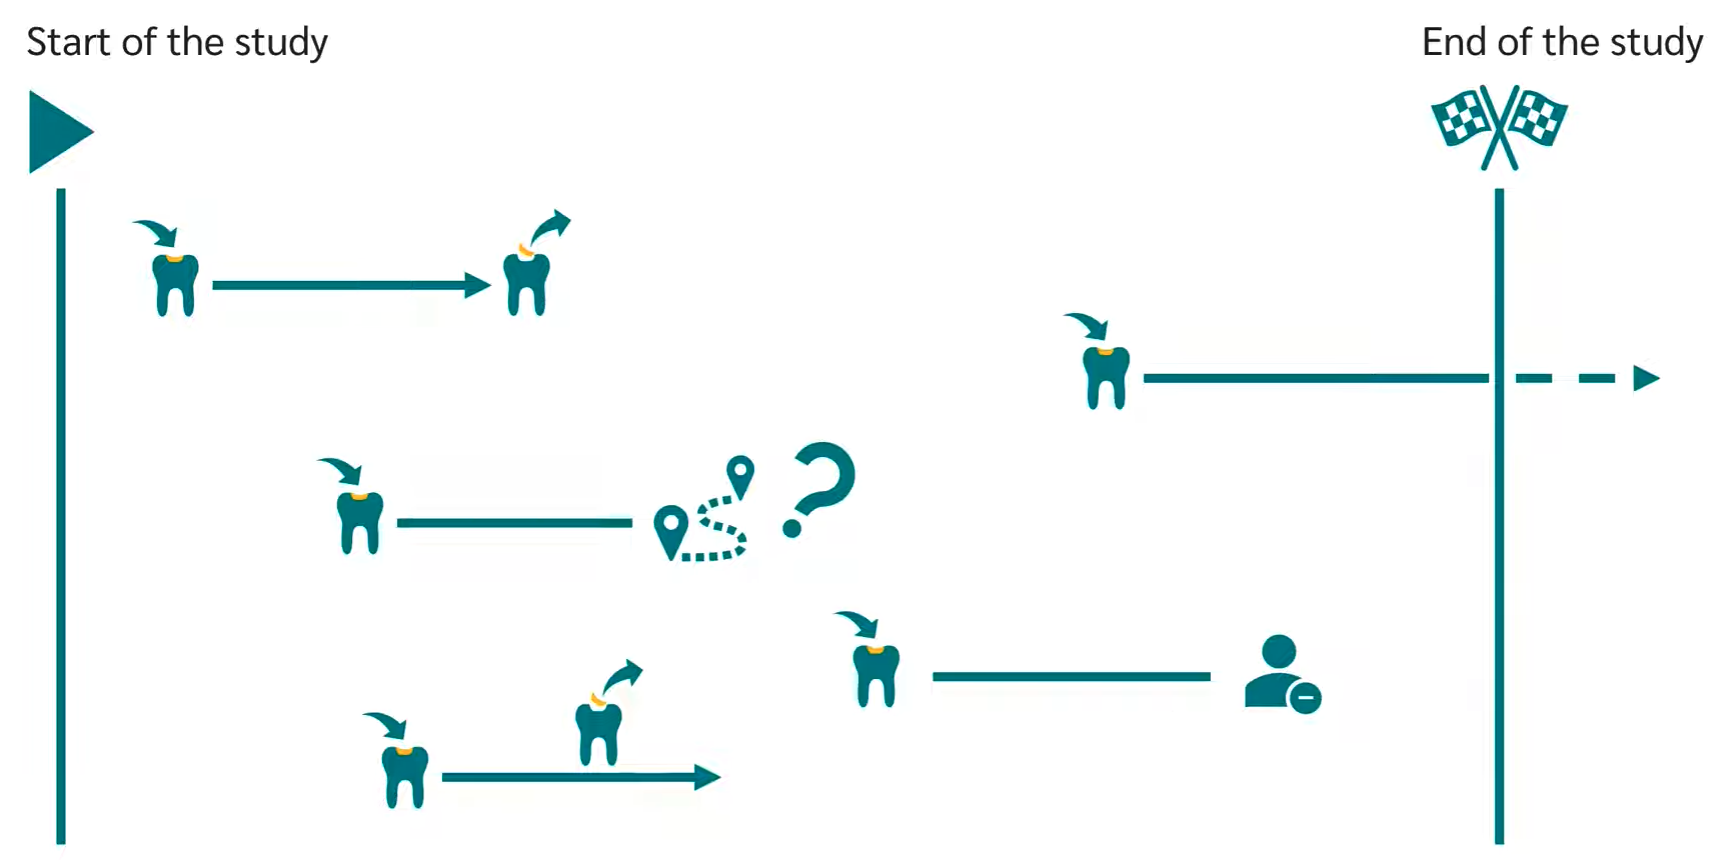
Always finite time period: start & end time period
Cases
| Treatment | Event | knowledge of true survival duration |
|---|---|---|
| within time period | within time period | ✅ |
| within time period | within time period but not noticed | ❌ |
| within time period | not within time period | ❌ |
| within time period | Discontinued study | ❌ |
| within time period | Unexpected event | ❌ |
Challenges to classification
- Less training data
- Pessimistic estimates due to choice of window
Challenges to regression
- Non-gaussian: \(T\) is non-negative; may want long tails
- If we just naively remove censored events, model will be biased predict lower survival, since the people who got removed due to censoring did not get diabetes (ever/yet)
Notation & Formalization
Let
- Data
- \(X=\) features
- \(t=\) time
- \(b(t)=\{ 0, 1 \} =\) binary indicator denoting whether time is of censoring/event occurrence
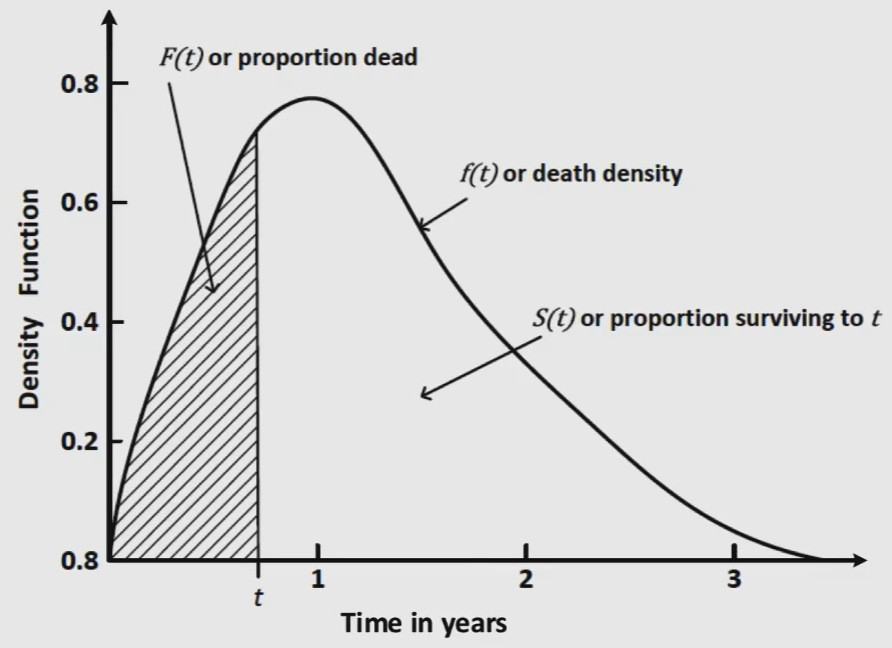
- \(f(t)=P(t) =\) probability of death at time \(t\)
- \(S(t) =\) probability of individual surviving beyond time \(t\)
- \(T_d=\) time of death
Methods
Kaplan-Meier Estimator
Graphical representation of survival function
- Non-parametric model
- Good for unconditional density estimation
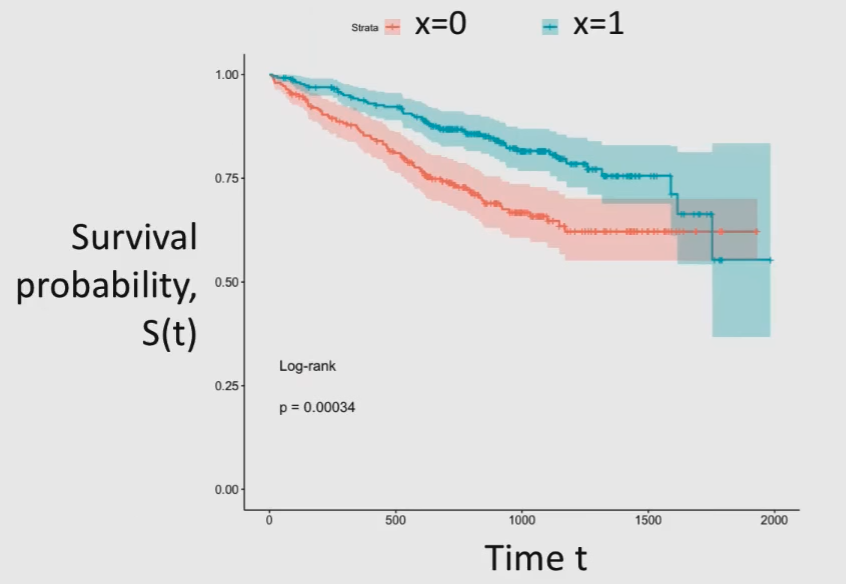
- \(d(t)=\) no of events at time \(t\)
- \(n(t)=\) no of individuals alive and uncensored at time \(t\)
Log-Rank Test
Compares the time until and event occurs of 2/more independent samples
“Is there a significant difference between the 2 curves”
Hypothesis test
- \(H_0:\) identical distribution curves
- \(H_1:\) different distribution curves
\(p < \alpha \implies\) reject \(H_0\)
Cox Proportional Hazards Model
Identify if there are other parameters that affect the curve
Evaluation
C-Statistic/Concordance-Index
Evaluate model’s ability to predict relative survival times
Equivalent to AUC for binary classification without censoring $$ \hat c = \dfrac{1}{n} \sum_{i: b_i=0} \sum_{j: y_i < y_j} I \Big[ S(\hat y_j \vert X_j) > S(\hat y_i \vert X_i) \Big] $$ 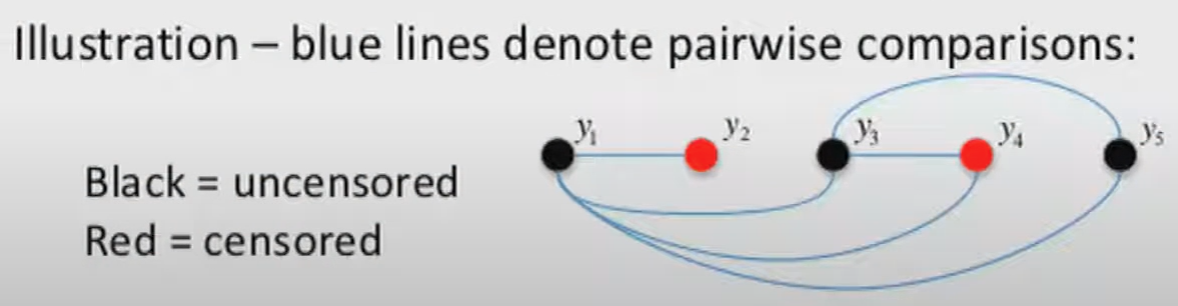
Mean-Squared Error for uncensored individuals
Held-out censored likelihood
Binary Classifier
Derive binary classifier from learnt model and check calibration